Introduction
Silverlight is a graphical toolkit for providing advanced visual displays and animation in web pages, using C# ASP .NET. The Silverlight API contains a flexible list of graph and chart controls, used for visualizing a vast array of data. As the Silverlight graph and chart controls are highly flexible, they provide the ability to apply custom styles and effects, changing the appearance of standard chart, graph, and grid controls.
In this tutorial, we’ll walk through creating a C# ASP .NET Silverlight web application for visualizing financial stock market data. Our Silverlight graph will display dividend amounts paid for a specific stock, equity, or bond over time. Our graphs will actually model a similar style to the Google Analytics chart display, providing an easy and modern way to view financial data. The dividend data will be retrieved using a WCF Windows Communication Foundation web service, which in turn, utilizes a strategy design pattern for reading data.
Silverlight Chart Visualizing Stock Dividends
Starting Off with Some Silverlight XAML
Before getting into the details behind retrieving stock market financial data, we’ll focus on developing the Silverlight graph user-interface in C# ASP .NET. Silverlight graphs are fairly easy to implement and quite powerful for styling. The Silverlight API provides a large amount of flexibility for styling the grid, graph, and controls to achieve a particular look and feel. To get started, we’ll need to define several libraries in our initial UserControl tag.
1 | <UserControl x:Class="DividendGraph.MainPage" |
In the above XAML code for our Silverlight graph, we’ve included the DataVisualization Charting controls. This allows us to access specific properties of the Silverlight graph charts, in order to apply custom styling. In particular, since we’ll be attempting to style similar to the Google Analytics graph, we’ll need to define the custom styles.
Silverlight Graph Custom Styling
The custom styles for the Silverlight graph can be defined as follows:
1 | <Grid x:Name="LayoutRoot" Background="White"> |
The above XAML Silverlight code provides the custom styling required for our desired look and feel. The Silverlight graph custom styling includes setting the size of the marker points, hiding the graph legend, setting graph line thickness, colors, data point styles, and axis styles. With the Silverlight custom styles defined, we can apply them as follows:
1 | <Grid.RowDefinitions> |
In the above code, we’re using a Silverlight Grid layout control to handle placement of the graph and associated controls. We’ve provided a Label and a TextBox for the user to enter a stock market equity symbol, in order to obtain historical dividend information. We’ll actually tie an event to the TextBox to automatically retrieve financial data upon keypress and update the Silverlight graph accordingly.
The above code also contains the main Silverlight chartingToolkit definition. The chartingToolkit contains a child graph control for a LineSeries graph. We’ll be drawing financial dividend data using the LineSeries graph with the custom style applied. Note how each Silverlight graph control contains styling definitions within StaticResource tags. This allows Silverlight to apply styling to specific properties of the graph and chart controls.
Notice we’ve also included a checkbox at the bottom of the Silverlight control, which will allow the user to toggle between displaying actual stock and bond dividend historical prices or to provide sample test data. We’ll manage the logic for retrieving the data using a strategy design pattern.
Plotting Data to a Silverlight Graph
Plotting data to the Silverlight graph control can be done programmatically by accessing the index of the chart control and setting the ItemsSource property with the data to be displayed.
1 | LineSeries ctlGraph = (LineSeries)ctlChart.Series[0]; |
In the above code sample, our XAML code defines a Silverlight chart named ctlChart. The chart defines a single LineSeries graph, accessible at index 0. By populating the ctlGraph.ItemsSource property, we can set the data to be plotted on the Silverlight graph and refresh the control.
As our C# ASP .NET web application will be utilizing a WCF web service to retrieve data for displaying within the graph, we’ll need to setup the associated wiring to call the WCF web service and bind the Silverlight graph.
Setting the Stage for WCF with a Simple Type Library
Before plotting data on the Silverlight graph, we’ll need to first obtain the data. We’ll start by defining two simple types to represent the Dividend and Time-Range information for visualizing stock market data. Since the Silverlight project will be directly referencing the types, we’ll need to define our type library project as a light-weight Silverlight class library, which links with a limited set of the .NET runtime, optimized for Silverlight. A Silverlight class library can be added within the Visual Studio .NET solution by selecting Add, New Project, Silverlight Class Library.
The Dividend class is a simple type for holding the date and price of a stock or bond historical dividend.
1 | public class Dividend |
The Range class is a type for holding the time range information, associated with retrieving financial information from the remote, Yahoo financial data, web service.
1 | public class Range |
With the Silverlight class library for types defined, we can begin implementing the backend C# ASP .NET web application for actually retrieving Wall Street data.
Unit-Testable Charting with Silverlight and WCF
We’ll be designing our C# ASP .NET Silverlight web application with a WCF web service for retrieving data. Stock market dividend financial data will actually be retrieved using a remote Yahoo web service. However, in addition to pulling live stock market data, we’ll also provide a unit-testable module, which will return artificial stock market data, simulating an actual call to a remote web service. By taking advantage of this dual design, we can provide a unit-testable interface and easier development of our Silverlight WCF web application.
Is It a Strategy or Repository Pattern
To implement the design for pulling stock market data, we’ll use the strategy design pattern in a familiar repository style method. We’ll define the interface, as follows:
1 | public interface IRepository |
The design is a strategy pattern by nature, as we can utilize the interface to implement multiple concrete classes (one for actual stock market data read via the remote web service and a second for simulated financial data). Our interface defines three Get methods, similar to a repository design, although no Set methods. While we can refer to the concrete classes as repositories, they’re actually strategy implementations by intention.
Class YahooRepository
1 | public class YahooRepository : IRepository |
We begin the concrete implementation for retrieving stock market data via the Yahoo web service by defining a GetURLStream method. This allows us to download a CSV file for parsing historical financial data. For corporate and enterprise environments behind proxy servers, the WebRequest object can be enhanced to provide the Proxy and Proxy.Credentials properties. When setting the proxy server information, instantiate a new WebProxy object, with the proxy server address and port. Next provide the Proxy Credentials object, which consists of a proxy server username and password. All requests through the WebRequest object will utilize the proxy server.
1 | private Dividend ParseDividendFromCSV(string line) |
We provide a method, ParseDividendFromCSV, for the actual parsing of the CSV data. We’ll stick with a basic solution for parsing the CSV data, using a comma-delimited parse method. We can then read the data and dividend price information for each line in the CSV file.
1 |
|
Finally, we complete the implementation of IRepository by providing the three Get methods. We assemble the required URL for retrieving stock market dividend data and parse the resulting downloaded CSV file. We then populate a Dividend class library type for returning through the WCF web service and plotting on the Silverlight graph.
Class TestRepository
While we’ve implemented the remote web service repository for retrieving stock market and bond dividend information, we’ll also want to implement a unit-testable TestRepository, for simulating financial data. A test repository can be defined as follows:
1 | public class TestRepository : IRepository |
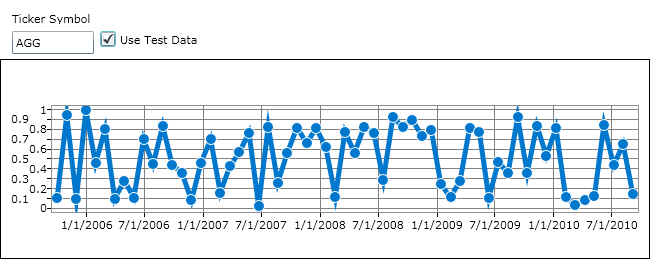
In the above code, we’ve used a random number generator, seeded with a DateTime ticks value, in order to generate simulated stock market data. We’ve implemented the same three Get methods, required by the IRepository interface, which allows us to return data in the same format to the WCF web service.
Note, in the GetByRange method, we utilize a C# .NET TimeSpan object to control looping through each month within the specified range of DateTime objects and generate associated stock market dividend financial data. Since the majority of dividends are less than $1 in value, we generate a random Double value. Just as with the YahooRepository, the TestRepository data can be returned via the WCF web service and plotted on the Silverlight graph for visualization.
Creating a Little WCF
To keep things simple, we’ll create a WCF web service within the same project as our Silverlight hosted web page project. This allows for easier security binding, as there is no need to cross domains or application boundaries. Both the Silverlight web control and the WCF web service will run under the same C# ASP .NET web project and web server port (ie., Cassini web port). However, if your WCF service will be hosted in a separate application or project within the solution (on its own web server port or IIS virtual directory), you’ll need to provide the following security policy XML files, accessible in the same directory as the WCF service (or wwwroot):
clientaccesspolicy.xml
1 | <?xml version="1.0" encoding="utf-8"?> |
crossdomain.xml
1 |
|
We can continue by defining the WCF web service interface, as follows:
1 | [ServiceContract] |
We’ll define our WCF web service contract to contain a single method, GetDividends, for retrieving the dividend information. This method will, in turn, call our repository library to obtain the actual information.
1 | public class DividendService : IDividendService |
In the above code, we’ve implemented our WCF web service from the IDividendService interface. We provide the body of the GetDividends method to prepare a date range to include 5 years from the present date. We then call the repository’s GetByRange method to return the requested stock market dividend data.
Note in the above code, we provide a GetRepository helper method, which utilizes the useTestData boolean (set in the Silverlight checkbox next to the graph), to return actual or simulated stock market data. The checkbox value is passed to the WCF web service as a parameter in the calling method. If the boolean flag is true, we instantiate a TestRepository; if the boolean is false, we instantiate a YahooRepository, thus implementing the strategy pattern design.
With our WCF web service completed, we can fully make calls to the web service and retrieve resulting XML. We can now connect the WCF web service to our Silverlight project and obtain data for plotting on the graph.
Wiring Silverlight with WCF
We’ll begin by adding a Service Reference from our WCF web service project to our Silverlight graph project. This can be done by right-clicking the Service Reference folder and selecting Add Service Reference. Click the Discover button to locate local WCF web services in the solution. Locate the DividendService for selection and click the Advanced button. We’ll need to specify the collection type used within the application, which in our case, will be System.Collections.Generic.List. Once the service reference is added, we can instantiate the service within our Silverlight project, as follows:
1 | private LineSeries _ctlGraph; |
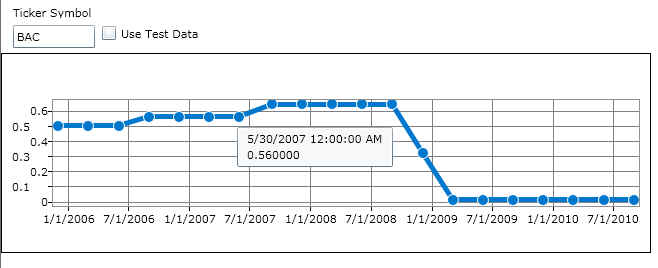
In the above code, we’ve added an instantiation of the WCF web service, which will retrieve financial dividend historical data from the Yahoo stock market web service, using C# ASP .NET. We’ve also added an event handler for the asynchronous WCF method GetDividendsCompleted, which occurs upon completion of retrieving financial data. We’ll actually bind and refresh the Silverlight grid within this event handler.
In addition to event handling, we’ll initialize the stock market ticker symbol TextBox to “BAC” and display default dividend prices for this equity.
1 | void _dividendService_GetDividendsCompleted(object sender, GetDividendsCompletedEventArgs e) |
The above code handles the GetDividendsCompleted event, which is called after the asynchronous WCF web service call has completed. Within this event handler, we’ll populate the Silverlight graph data source to update the chart.
1 | private void txtTicker_TextChanged(object sender, TextChangedEventArgs e) |
We’ve also provided an event handler for the TextChanged event on the Silverlight TextBox control. When the user enters a string of 3 characters, we’ll automatically update the Silverlight graph with stock market dividend information for the entered stock symbol. Of course, this logic could be enhanced to allow for variable-range stock symbols.
1 | private void chkTestData_Checked(object sender, System.Windows.RoutedEventArgs e) |
The remaining methods in the Silverlight server-side code handle re-painting the graph when the test checkbox is changed and calling the WCF web service method. You can download the source code to the project here. Be sure to set the Startup Project to be DividendGraph.Web, in order for the Silverlight web application host and WCF service to run (right-click DividendGraph.Web and select Set As Startup Project).
Example Display for Test Repository
Conclusion
The C# ASP .NET Silverlight API provides a large amount of flexibility in styling the chart and graphing controls for advanced visual displays. By coupling the Silverlight graph with WCF web service capability, C# ASP .NET web applications can visualize and display a vast array of data, including stock market financial information and historical dividend data. Utilizing a separation of layers between the user interface and data layer, web application design can help facilitate TDD test-driven development and help provide a more robust and scalable web application solution.
About the Author
This article was written by Kory Becker, software developer and architect, skilled in a range of technologies, including web application development, machine learning, artificial intelligence, and data science.
Sponsor Me