Introduction
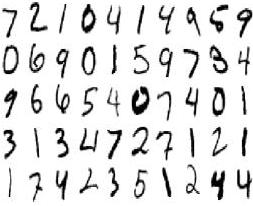
Developers looking for their first machine learning or artificial intelligence project often start by trying the handwritten digit recognition problem. The digit recognition project deals with classifying data from the MNIST dataset. The data contains 60,000 images of 28x28 pixel handwritten digits. By using image recognition techniques with a selected machine learning algorithm, a program can be developed to accurately read the handwritten digits within around 95% accuracy. The rate can be even higher, depending on the selected machine learning algorithm.
As digit recognition is a great place to start with machine learning, it’s not surprising that the machine learning competition site, Kaggle, offers this problem as one of their introductory competitions. Of course, there are many different kinds of problems that you can solve with machine learning and AI, and digit recognition is a great place to start.
In this article, we’ll walk through a basic solution in C# .NET for accurately reading the handwritten digit dataset. We’ll use an SVM for the core machine learning algorithm and take a look at some basic learning curves to judge how well we’re doing. In the end, we’ll see how to achieve 97.5% accuracy.
Why Digit Recognition?
For some brief background regarding handwritten digit processing with machine learning, lets note some interesting features about being able to process this kind of data. Handwritten digits are a common part of everyday life. One of the first uses that comes to mind is that of zip codes.
A zip code consists of 5 digits (sometimes more, depending if the trailing digits are included), and is one of the most important parts of a letter for it to be delivered to the correct location. Many years ago, the postman would read the zip code manually for delivery. However, this type of work is now automated by using optical character recognition (OCR) - similar to the type of solution we’ll be implementing in this article!
The Data
The original MNIST dataset consists of actual images, already pre-processed and formatted in 28x28 gray-scale images. If you use the Kaggle dataset, the image pixel data is already encoded into numeric values in a CSV file.
The CSV file contains several thousand rows for training data. Each row contains of a label (the handwritten digit) as the first column, with the remaining columns being the pixel color data (values of 0-255).
For example. for the digit ‘7, the data will appear as:
7,0,0,0,0,255,127,0,0 … 86, 0, 255, 0
This makes it relatively easy to process the data, read it into a memory array, and process with our machine learning algorithm.
Breaking the Training Data In Half
One of the more important parts of a machine learning solution is separating your data into actual training data and cross validation data. Training data is used by the learning algorithm, usually in a supervised learning model, to increase accuracy. The label (answer) is provided for each row in the dataset, so the algorithm can learn which data corresponds to which handwritten digit. However, in order to really know how well the program is doing, we need to run it on data that it’s never seen before. That’s where the cross validation set comes in.
We’ll split the training set in half. The first half will remain as the training data. The second half will serve as the cross validation data. We’ll provide the training portion to the learning algorithm, along with the answers. After training has completed, we’ll run the algorithm again on our cross validation data to see just how accurate the solution really is. Since we have the digit labels (answers) for both the training and cross validation sets, we can calculate an accuracy percentage.
Using the above technique, we can build a learning curve over gradually increasing sets of data (250 rows, 500 rows, 750 rows, 1000 rows, etc) to determine if the algorithm is actually learning anything. This lets us know if we should bother running the program all day long or scrap our project and try a different solution.
With that in mind, we now have two files: train.csv (training data) and cv.csv (cross validation data).
Setting Up the Project
Since we’ll be creating a solution in C# .NET, we’ll use the Accord .NET library to implement the machine learning algorithm, specifically a support vector machine (SVM).
The main program for running our solution is relatively simple, as follows:
1 | static void Main(string[] args) |
As you can see in the above code, we first run the machine learning algorithm on our training set. This trains the algorithm so it’s ready for actual data. We then run the algorithm against the cross validation set to gauge the true accuracy. Finally, we run on the test set.
Parsing CSV Data
Before running the SVM, we need to read the data from the CSV file into memory. Specifically, we’ll read the data from each row into an array of doubles, with each label (handwritten digit answer) being an integer.
A basic data type can be used to hold each row of data. This data type can be re-used for most machine learning problems.
1 | public class MLData |
The above class can easily be converted into a multi-dimensional array of doubles and an array of ints (labels) for all rows in the data set.
1 | List<MLData> rows = ReadData("train.csv"); |
In the above code, we parse the CSV file to obtain a list of MLData objects. A simple LINQ query is then used to convert the fields into arrays required by the Accord .NET library. Of course, you could certainly read the data directly into arrays to begin with, and this would be faster. However, using a defined data type allows for easy reuse of the code.
Parsing the actual csv file itself can be made easier by using the CsvReader C# .NET class. We can parse the file, as follows:
1 | public List<MLData> Parse(string path, int maxRows, IRowParser rowParser) |
With some refactoring and modular code using the strategy design pattern, a reusable library can be created to easily parse CSV files for processing by the machine learning algorithms. Note, in the above code we’re using our own IRowParser interface to do the actual processing. This gives us flexibility with reading CSV files of differing formats (label at the front, label at the end, no label for test data, etc).
The base parsing code, appears as follows:
1 | public override int ReadLabel(CsvReader reader) |
You can see the project source code for the complete implementation.
Normalizing the Values
If you try running the SVM against the raw data, you’re likely to get poor results upon cross validation, with regard to accuracy. This is due to the values (0-255) being too variable for the learning algorithm to process. We can solve this by normalizing the data so that each value falls within 0 - 1. This is also called feature scaling. The following normalization equation can be used:
X = (X - min) / (max - min)
X = (X - 0) / (255 - 0)
X = X / 255
1 | double Normalize(double value) |
Are We Learning Anything?
It’s important to use learning curves to tell if we’re actually getting anywhere with the data. Some data simply fails to produce learning associations. This is due to varying degrees of bias and variance in the data. Bias refers to how well the learning algorithm fits the training data, while variance refers to how close the learning algorithm’s results are for training data and test data (or more typically, cross validation data).
We can loop over the learning process, using gradually increasing sets of training data to plot a learning curve.
1 | for (int i = 0; i < 2000; i += 250) |
In the above code, we start with 250 rows of data. We train the algorithm and get the accuracy from the cross validation set. We then increase the set size to 500 and repeat until we reach 2000 rows of data. At the end of each iteration, we print the training and cross validation accuracy to the console. You can loop even further to get more accuracy data points, although the program is CPU intensive, so you’ll want to limit the iterations. Finally, you can plot the accuracy numbers on a chart (eg., Excel) to get a visual look at the degree of learning taking place.
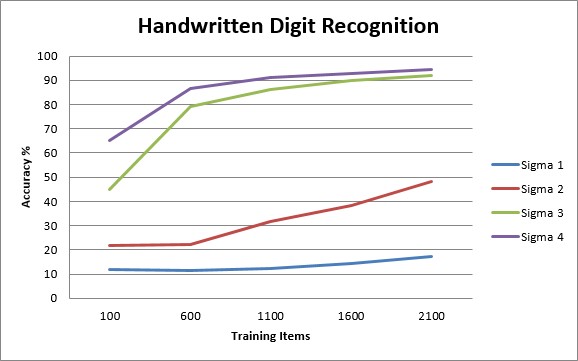
You’ll typically run the above code each time you tweak the learning algorithm. For example, changing the SVM gaussian sigma value. Or adjusting the number of layers in your neural network. Or even tweaking the data itself. Any change made to the learning process can dramatically change the accuracy over larger amounts of data.
For this project, a gaussian SVM was used with varying values for sigma, ranging from 1 to 5. After running the loop above, the data points were collected and plotted on a graph, allowing an easy view of the best learning algorithm. Note which line in the chart below has the highest accuracy over the largest amount of data.
Results?
The final result, using an SVM with a gaussian kernel, produced an accuracy of reading the handwritten digits as follows:
Training: 99.55%
Cross Validation: 97.49%
You can try other learning algorithms to see how they differ, with regard to accuracy. With some fine-tuning and a little “creativity”, you can get some impressive results. :O

About the Author
This article was written by Kory Becker, software developer and architect, skilled in a range of technologies, including web application development, machine learning, artificial intelligence, and data science.
Sponsor Me