Introduction
Neural networks can be used for some pretty fascinatingly flexible solutions. Typical examples includes bitwise logic (AND, OR, XOR), classification of data, image recognition, and more recently, self-driving cars. You’ve probably heard about many of these examples already. But, have you ever heard of neural network sorting? Well then, read on!
This tutorial demonstrates the (perhaps, no so) surprising result of training an artificial intelligence program to sort numbers. We’ll create a simple example of a neural network in R. We’ll feed it a training set of 3 numbers, from 1 to 100, in random order. The program will learn to output the numbers in ascending order.
A Simple Neural Network Example in R
I’ve written a couple of articles on neural networks in the past, with examples in both C# and Javascript. For the past year or so, I’ve been working with R for the majority of my machine learning projects. I’ve found R to be one of the easiest and fastest ways to get a machine learning project up and running. Using the neurondotnet C# library or the brain node.js module, usually required a bit of mangling with data to get it in the correct format for training. With the help of R’s caret library, it’s much faster getting a project running. Not to mention, R has a huge list of built-in machine learning models ready for use.
Let’s start with the basics. Below is the code for a very simple neural network in R. This neural network learns how to calculate the square root of a number. The code is shown below.
1 | library(caret) |
In the above code, we simply generate some random numbers to find the square root. We have both a training and cross-validation set. We then run the “train” method, using a neural network model. In this example, we’re simply using 1 input node (the number to find the square root of), 6 hidden nodes, and 1 output node (the square root). The train method figures out the number of nodes for input and output, based upon the data. So, that’s pretty handy.
The final three lines of code simply run the trained neural network on our cross-validation data. The output looks like this:
1 | x y predict |
Since the neural network output will have float values, we’ll just round the values. These are shown in the “predict” column below.
1 | x y predict |
As you can see, the neural network has successfully trained on the square root of a number (with 90% accuracy).
That’s a pretty simple example of a neural network in R. And it’s less than 10 lines of code. Now, back to our main project!
Neural Network Sort
It’s time to sort some numbers. The input to our neural network will be 3 numbers from 1 to 100. The output will be the same numbers in ascending order. We’ll use 2 hidden input layers of 40 neurons each, trained to a threshold of 0.001, with a learning rate of 0.6, and a training set size of 750 examples. Here’s the code:
1 | library(neuralnet) |
Aside from the two helper methods for generating and de-normalizing data, the code is fairly straight-forward. We cut the generated data in half for a training and cross-validation set. Then we train the neural network. Once complete, we count the number of correct results on both the training and cv sets. This gives us our final accuracy. You can then run the neural network on any new data and it should be able to successfully sort any 3 numbers within the range of 1-100.
Choosing the Neural Network Parameters
The method I used to identify the number of neurons and various configuration parameters was through learning curves.
You can create a learning curve by first choosing specific parameters for the network. Then run the network over gradually increasing numbers of training sets.
For example, run the network on 25, 50, 75, 100 examples. At the lowest number, the training accuracy should be near 100%. After all, it’s usually easy for a neural network to learn to match the output from a couple of training examples. The cross-validation set, which the network has not trained on, should have a very low accuracy. As the examples increase, the training accuracy should decrease slightly (more examples take more effort to train) and the cross-validation accuracy should increase (more examples lead to more learning). Eventually, the two accuracy lines tend to converge.
The R code, for generating the learning curve for this project, draws a chart like this:
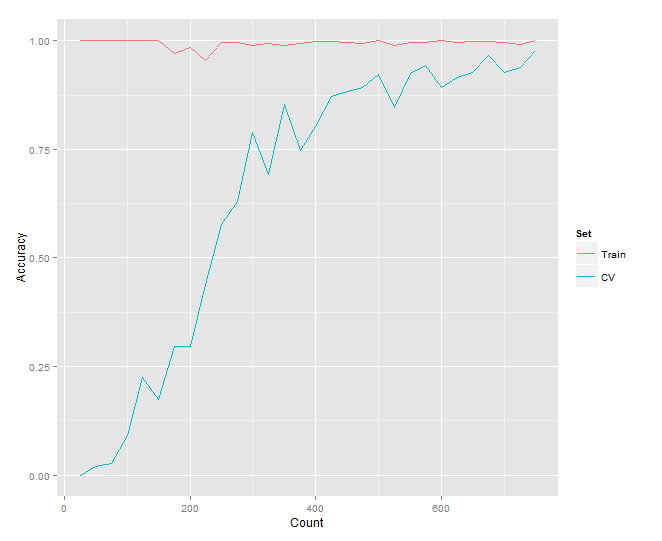
You can see how the two curves for the training set and cross-validation set converge towards a common accuracy. Now, keep in mind, since we’re generating sets of 3 numbers from 1-100, there is a finite number of possible arrangements. If we train the network on all of them, we’ve defeated the purpose! Luckily, there are 1,000,000 possibilities, and we’re only training on 750 of them (or 0.075%). Looking at the graph, we could probably train on just 300 examples and still achieve an accuracy around 80%. Let’s take a look at the results.
Results
Sorting 3 Numbers
After training Neural Network Sort on 750 examples of sorting 3 numbers, we see an accuracy of 100% training / 98% cross-validation.
Here is Neural Network Sort running (note, the variable named “fit” is our neural network model):
1 | Training: 100 % / CV: 97.9 % |
Ok, that was running on just 10 samples. Let’s try it on something bigger (5,000 examples).
1 | > test <- generateSet(5000) |
Sorting 4 Numbers
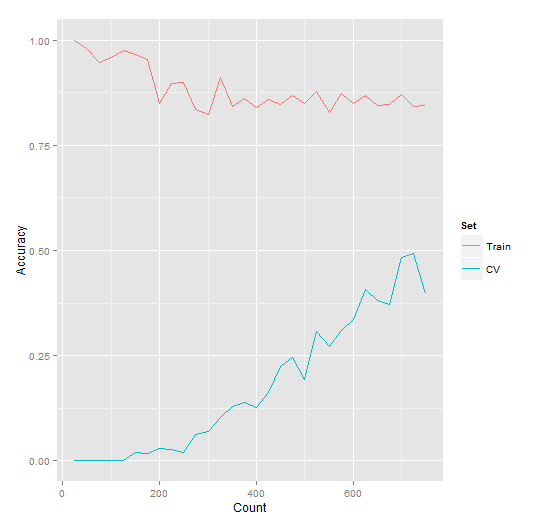
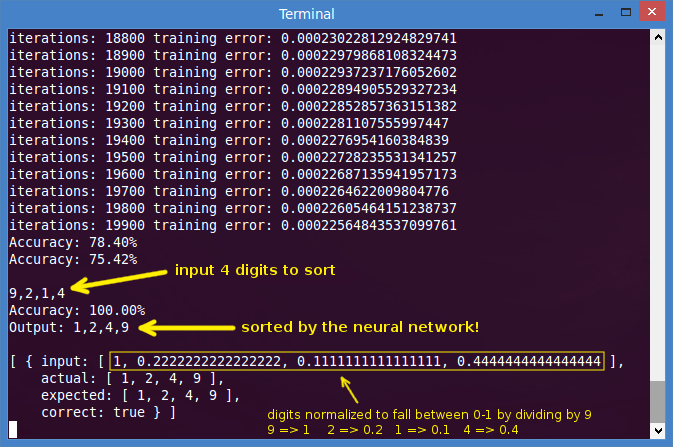
Increasing the number of values to sort will result in increased complexity. Using the same training set size of 750 examples (this time, sorting 4 numbers), we see an accuracy of 87% training / 50% cross-validation. The code was modified to simply include an extra number in the generation data and an extra input/output node to the neural network.
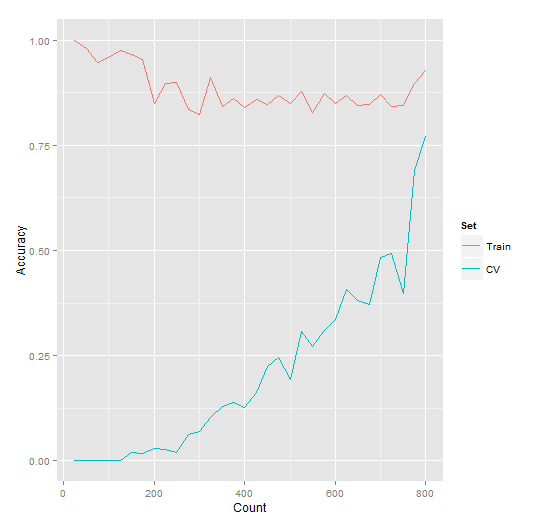
Notice in the learning curve for this new training set, the complexity increase can be seen, as shown by the reduced accuracy. Longer training, along with a larger training set, would do much better. You can tell this by looking at the learning curve below, since the cross-validation accuracy continues to increase with more training examples. Based on this chart, we might predict convergence around 80%.
Let’s prove it. If we bump the training up to 1,500 examples (which took 4 hours to train on a Quad-Core I7), we get an accuracy of 93% training / 77% cross-validation.
Neural Network Sort Wrapper
We can wrap the manual sorting code into a helper method named nnsort, as follows:
1 | nnsort <- function(fit, scaleVal, a, b, c) { |
Then run it:
1 | > nnsort(fit, data, 100, 20, 32) |
Saving and Loading a Trained Neural Network
A previously trained neural network can be saved for future use, with the following commands:
1 | # Save the neural network to disk. |
You can then load the trained neural network to run it. Here are the download links for the trained neural networks to sort 3 numbers and 4 numbers.
After downloading, you can run the trained network as shown below.
1 | library(neuralnet) |
Conclusion
Neural networks can do a lot of things. As we’ve just demonstrated, sorting is one of them. Source code for this project is included above. There is also a version in node.js available as well. The javascript model is slightly different, but follows the same general pattern.
About the Author
This article was written by Kory Becker, software developer and architect, skilled in a range of technologies, including web application development, machine learning, artificial intelligence, and data science.
Sponsor Me